Advanced resource analytics
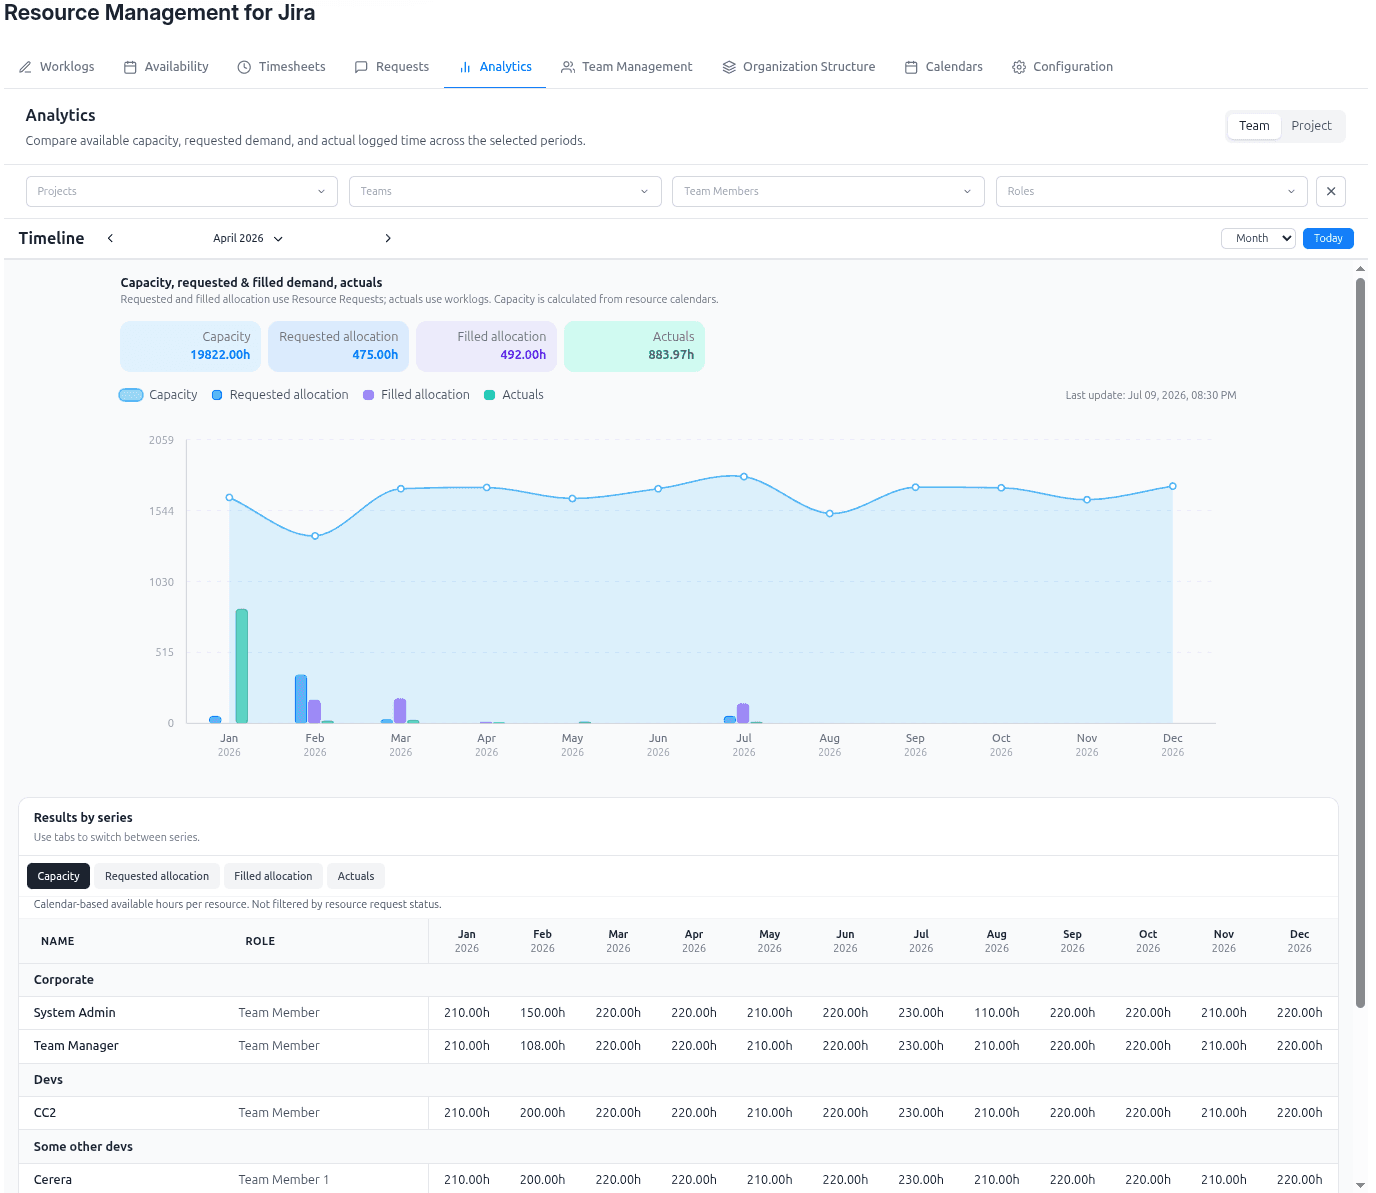
The Analytics tab gives PMOs, Team Managers, Project Managers, Requesters, and (optionally) individual team members one place to compare the signals that drive staffing decisions:
- Demand coming from project resource requests
- Filled allocations already assigned to people
- Available capacity based on real calendars and working time
- Actuals from Jira worklogs
This helps you move from reactive coordination to proactive portfolio steering. Instead of reviewing requests, assignments, and worklogs in isolation, you can see how they evolve across the same timeline and use that visibility to balance team capacity against project needs.
Why this matters
Advanced resource analytics helps teams answer questions such as:
- Are we likely to overload a team in the next weeks or months?
- Is incoming demand being converted into assignments fast enough?
- Are actual logged hours tracking the original staffing plan?
- Which teams, roles, or projects need intervention before delivery risk becomes visible?
In practice, this means you can:
- detect capacity shortages earlier
- compare planned work with real execution
- identify persistent fulfillment gaps
- make more confident staffing and prioritization decisions
- improve forecast quality for upcoming periods
Who can see Analytics
| Role | Access |
|---|---|
| Instance Admin | Full access |
| Resource Management for Jira App Admin | Full access |
| Team Manager | Team mode |
| Project Manager | Project mode (demand from all resource requests on managed projects) |
| Requester | Project mode by default: Requested / Filled from their own resource requests; Actuals at project level for those projects. Optional Team self-scope when Let viewers see their analytics is on. See Access Control & Governance Roles. |
| Team Manager + Project Manager | Both Team and Project modes |
| Viewer | Self-scope (“my load”) when Let viewers see their analytics is on (default). No Team/Project mode switcher. |
The Analytics tab is controlled by Enable analytics. For viewers, Let viewers see their analytics must also be on (Configuration → Application settings; both default on). That viewer toggle does not gate Analytics for Requesters or higher roles.
Requester Project mode
Requesters use the same Project mode UI as Project Managers, with a narrower demand filter:
- Requested allocation and Filled allocation come only from resource requests they created (on projects where they have Request resources)
- Actuals are project-level worklogs for those same projects (so they can compare plan vs execution without seeing other authors’ requests)
- Default mode is Project; Team self-scope (“my load”) is available only when Let viewers see their analytics is on (Requested allocation is hidden in that mode). Full Team-manager Team mode requires being a Team Manager.
Viewer self-scope
Viewers see only their own data:
- Capacity from their effective calendar
- Filled allocation from accepted/closed requests where they are assigned
- Actuals from their own worklogs
Requested allocation (open demand against teams) is hidden — that signal is for managers and requesters planning capacity, not for individuals reviewing their own load.
Two analytics modes
Team mode
Use Team mode when you want to understand whether your managed teams can realistically satisfy current and upcoming demand.
This mode is best for:
- checking whether team capacity can absorb new requests
- comparing requested work, assigned work, and actuals for the teams you manage
- spotting overloads, unused capacity, or mismatches between staffing plans and execution
In Team mode, you can compare:
- Capacity
- Requested allocation
- Filled allocation
- Actuals
Project mode
Use Project mode when you want to understand delivery progress and staffing fulfillment from the project perspective.
This mode is best for:
- reviewing whether projects are getting the capacity they asked for
- comparing planned staffing with actual logged execution
- identifying projects that are underfilled, delayed, or drifting away from plan
In Project mode, you compare:
- Requested allocation
- Filled allocation
- Actuals
Project mode does not show a separate capacity series, because the focus is the project delivery view rather than team supply.
What the screen shows
Filters
The top filter bar helps you narrow the analysis:
- Projects
- Teams
- Members
- Roles
You can combine these filters to answer very specific questions, such as:
- a single project across multiple teams
- one delivery team across many projects
- a specific role, such as QA Engineer or Product Manager
- one resource or a subset of specialists
Timeline
The timeline lets you move backward and forward across periods and switch the granularity of the view:
- Day
- Week
- Month
By aligning the analysis to these specific scales, you can move from retrospective analysis of past performance to forward-looking analysis of upcoming staffing pressure.
Summary tiles
At the top of the chart, the tiles summarize the visible totals for each series. This gives you an immediate snapshot of:
- how much work is being requested
- how much has already been assigned
- how much capacity is available
- how much effort has actually been logged
Chart
The chart visualizes how the selected series change over time. It is designed to make trends and imbalances visible quickly, for example:
- sustained demand that is above available capacity
- assignments that lag behind requested demand
- actuals that differ materially from allocations
Results by series
Below the chart, the Results by series area breaks the totals into detailed rows so you can inspect where the numbers come from.
Depending on the selected tab, you can review:
- capacity by team member / role
- requested allocation by request / role
- filled allocation by assignment / resource
- actuals by worklog-driven execution rows
This helps you move from an executive-level signal to the concrete people, roles, and projects behind it.
What each series means
To ensure your analysis is accurate, it is important to understand exactly what data contributes to each series.
Capacity (Team Mode Only)
The amount of available working time for the selected people and periods, based on effective calendars and approved availability. Use it to understand the real supply side of your managed teams.
Requested allocation
The demand raised by projects through resource requests.
- What counts: Only requests in a committed state (
Submitted,Resource Assigned,Review,Accepted, orClosed). - Baseline: Demand is calculated using the Project's Calendar, ensuring that request hours are scaled to the project's specific working-time rules rather than an individual's personal calendar.
Use it to understand how much capacity projects are asking for, even before all assignments are finalized.
Filled allocation
The part of demand that has already been assigned to specific people or roles.
- What counts: Only assignments tied to requests that have been formally Accepted or Closed. Assignments in the
RevieworResource Assignedstage are proposals and do not count toward filled allocation.
Use it to understand how much of the requested work has actually been staffed.
Actuals
The hours that were actually logged in Jira worklogs. Use it to compare real delivery effort against the original staffing picture.
Typical use cases
PMO: review the portfolio outlook
Use Analytics to compare demand, filled allocations, and actuals across multiple teams and projects. This helps PMO stakeholders spot structural delivery risks earlier and prepare better portfolio reviews.
Team Manager: protect team capacity
Use Team mode to see whether incoming demand is running ahead of available capacity, whether assignments are realistic, and where your team may be overcommitted or underused.
Project Manager: track fulfillment and execution
Use Project mode to see whether requested staffing is being fulfilled and whether the project’s actual execution is aligned with the approved allocation plan.
Delivery leadership: improve forecast confidence
Use the same timeline to look backward and forward: analyze past execution patterns, then inspect upcoming demand and staffing pressure to reduce surprises in future periods.
How Analytics works with other tabs
- Resource Requests provides the demand and assignment signals used in Analytics.
- Timesheets gives a more tabular plan-vs-actual view for approvals and operational follow-up.
- Worklogs provide the actual effort that feeds execution visibility.
- Calendars, availability, and Team Management keep the capacity side realistic.
See also:
Recommended way to use it
- Start with a time range that matches your planning horizon.
- Choose Team or Project mode depending on the decision you need to make.
- Narrow the view with projects, teams, members, or roles.
- Compare demand, filled allocations, capacity, and actuals on the chart.
- Open the Results by series section to identify the exact teams, people, or requests behind the signal.
- Adjust requests, assignments, or planning priorities before the gap becomes a delivery problem.
Related guide: Capacity Planning in Jira — the strategy behind comparing demand, capacity, and actuals.